


Introduction
Intracytoplasmic injection of sperm into the egg (ICSI) was introduced into clinical practice in the early nineties.1 To date, ICSI remains the main method of overcoming male infertility. However, the success rate of ICSI is still below 100%: the main document available as a reference indicates 65–80% fertilization as normal values.2 Moreover, several papers describe the impact of the ICSI on fertilization outcomes.3–5 Several tips and tricks are used to improve the effectiveness of ICSI. For example, when ICSI was performed on oocytes, it tended to degenerate; a tangible positive effect was shown when using laser zona pellucida incision6 and Piezo-ICSI.7
Interestingly, it has been shown that the ICSI operator does not affect the cumulative pregnancy rate8 or the oocyte degeneration rate.9 According to some trials, the proportion of normally fertilized oocytes in conventional ICSI is greater than in piezo-ICSI and laser-assisted ICSI in other trials (see Table 1). Comparative analysis of the literature makes one think that, although ICSI outcomes within one laboratory do not depend on the operators as they perform this procedure similarly, the fertilization rate differs from laboratory to laboratory because of internal lab ICSI technique standards.
Thus, we are challenged to find the characteristic features of the ICSI procedure associated with proper fertilization and embryo development to the blastocyst stage. The study aims to investigate the influence of the ICSI process on fertilization and blastulation rate to enhance future IVF outcomes.
Materials and methods
Upon receiving approval from the Ethical Board, 80 patients were enrolled in the study, meeting the criteria for ICSI due to male factors, unexplained infertility, or the use of thawed oocytes. Patients with non-ejaculated sperm were excluded. The mean age of participants was 34.18±5.23 years, with maximum recruitment of 7 oocytes per patient. 385 videos documenting the ICSI procedure were recorded, with individual oocytes cultured up to the zygote stage. Follow-ups until day 5/6 of embryo development were conducted in 211 cases.
Outcomes Assessment
The primary outcome assessed was the fertilization status 16–19 hours post-ICSI, while the secondary outcome focused on the rate of good-quality blastocysts on day 5/6 of embryo development.
Procedures
Oocyte retrieval took place 35–36 hours post-trigger administration, followed by denudation and immediate ICSI between 38.5–40 hours post-trigger. Ooplasm volume aspiration was performed during ICSI to facilitate oolemma rupture. Injected oocytes were cultured in 30 µl of medium (Sage One step, Cooper Surgical) under oil (Ovoil, Vitrolife, Goteborg, Sweden), with medium change on day 1.
Measurement Techniques and Parameterization
The fertilization rate was determined by dividing the number of zygotes with two pronuclei (2 PN) observed 16–19 hours after ICSI by the total number of injected oocytes. Similarly, 0 PN, 1PN, ≥3PN, and degeneration rates were calculated using the same method. The blastocyst good quality rate was assessed by counting the number of good-quality blastocysts on day 5 or 6 (Bl 2, Bl 3, Bl 4, Bl 5, Bl 6; scored AA, AB, BA, and BB according to Gardner and Schoolcraft14), and dividing it by the total number of fertilized oocytes.
The inner diameter of the injection needle ranged from 4.3 to 4.9 micrometers. During the ICSI procedures, the distance between the needle bevel base and the sperm was measured at the moment of oolemma breakage (see Fig. 1) and at the moment of needle withdrawal from the oocyte (see Fig. 2). Some individual videos were excluded from specific measurements due to technical issues such as video quality or oocyte granularity. Distance measurements were conducted using a custom Python script.
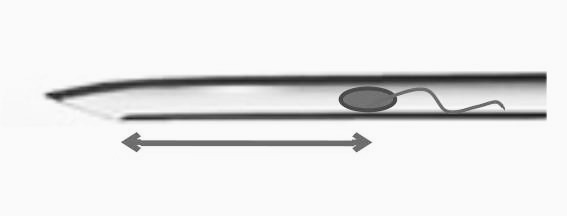

Based on the distance between the needle bevel base and the sperm at the moment of oolemma breakage, cases were categorized into four groups: 1) distance corresponding to 0–0.5 diameter of the oocyte; 2) 0.5–1 diameter of the oocyte; 3) 1–1.5 diameter of the oocyte; 4) over 1.5 diameters of the oocyte. With the internal diameter of the ICSI needle, these distances corresponded to aspiration volumes of < 4 picoliters, 4–8 picoliters, 8–12 picoliters, and over 12 picoliters.
Two parameters were utilized to determine the relative position of the ICSI needle and the sperm at needle withdrawal. The first parameter was the distance between the sperm and the needle bevel base, normalized to the length of the needle bevel. This led to the classification of all ICSI cases into four groups (A, B, C, and D) based on the length of the needle bevel.
Intragroup analysis was conducted for groups A and B, focusing on the sperm location: whether it was near the ICSI needle or immersed into the oocyte at the moment of needle withdrawal (see Fig. 3). Additionally, all cases were divided into two groups based on the type of oolemma breakage. In group I, the oolemma ruptured at the moment of ICSI needle insertion into the oocyte, while in group G, the oolemma ruptured after needle insertion, forming a funnel.


Results
A total of 385 oocytes from 80 patients were injected. The overall fertilization rate was 81% (312/385), with corresponding rates of 0 PN, 1 PN, 3 PN, and degeneration at 8.6% (33/385), 3.9% (15/385), 3.6% (14/385), and 2.8% (11/385), respectively. Of the injected oocytes, 211 zygotes were individually tracked up to the blastocyst stage, of which 93 (44%) developed into good-quality blastocysts on day 5 or 6 of development. Sequential analysis was conducted in groups 1–2–3–4, A-B-C-D, and G and I.
Comparison of groups with different distances between the sperm and needle bevel base at the moment of oolemma breakage (groups 1–4, see Fig. 1) did not reveal any significant difference in oocyte degeneration rate, 3 PN rate, 1 PN rate, or good-quality blastocyst development rates. However, an increase in the 0 PN rate correlated positively with increasing distance from group 2 to group 4, followed by a subsequent decrease in the fertilization rate, although this difference was insignificant. Results are detailed in Table 2.
When comparing groups A-B-C-D (see Fig. 2, Table 3), no significant difference was found in the proper fertilization rate. However, in group A, where the distance from the spermatozoon to the needle bevel base was up to half of the needle bevel length, fertilization was 71.4%, below the benchmark value according to Alpha Consensus. The absence of fertilization in this group was registered in almost every 5th case (19.6%; 11/56), while in group C, with the distance from the sperm to the needle bevel base corresponding to up to one and a half lengths of the needle bevel, the absence of fertilization rate was just 2.4% (3/125). The 0 PN rate differed significantly between groups A and C.
For groups A and B, a binary marker was applied to determine whether the sperm was inside the needle cannula or if there was some space between it and the needle (see Fig. 3). The proper fertilization rate decreased if, at the moment of needle withdrawal from the oocyte, the sperm was inside the needle lancet. The fertilization rate for the “sperm in the trumpet” group (A1+B1) versus the “sperm out of the trumpet” group (A2+B2) differed significantly (p=0.0017), comprising 66% (46/69) and 85% (113/132), respectively. These results are presented in Table 4.
In groups G and I, the degeneration rate was 12-fold higher in group I, possibly due to the rigid zona pellucida, subsequently elevated pressure at the time of ICSI needle insertion, and lower membrane elasticity in group I. These results are presented in Table 5.
Interestingly, in two videos, the ICSI needle dragged a cumulus cell through the zona pellucida, and this feature of ICSI was associated with a 3 PN fertilization status.
To validate our data, we analyzed the ICSI outcome of one operator before and after implementing ICSI with the specific final positioning of the sperm. The average fertilization rate of the operator was 75.1% (1168/1555) before and 84.2% (557/662) after the implementation of this technical tip, respectively (p < 0.0001). This increase in the fertilization rate was followed by a significant decrease in the 0 PN rate: from 16.9% (263/1555) to 10% (55/534; p=0.0002).
Discussion
It has been universally agreed upon that two necessary conditions are required for successful ICSI: partial damage to the sperm membrane and oolemma breakage. Previous studies have shown that forceful immobilization of sperm and ooplasm aspiration into the ICSI needle until membrane breakage is associated with better fertilization rates.15
This study highlights the importance of the “diving” of sperm into the oocyte at the moment of needle withdrawal. Several factors can explain this phenomenon. First, if the sperm is near the needle bevel, it may not contact the oolemma properly due to the rapid restoration of the membrane hole. Second, the position of the sperm just behind the needle tip may be associated with more aggressive ICSI and mechanical activation of the oocyte.16
Our data suggests a trend towards a decrease in fertilization rate when sperm is placed too far from the needle tip (group C; see Table 3, Fig. 2). This may be due to an association between ooplasm viscosity and oocyte quality.13 In 2006, Yanaihara et al.5 demonstrated that if sperm remained near the introducing position after ICSI, the fertilization rate was lower compared to other regions. This result aligns with our findings because this sperm retention position corresponds to group A in our study (sperm near needle bevel base at needle withdrawal moment).
We also measured the maximum distance between sperm in the needle and the needle bevel base at the moment of oolemma breakage (see Fig. 1). This parameter is valuable as the embryologist influences it during ICSI. Our study did not confirm previous findings that the blastulation rate decreases significantly with ooplasm volume over 6 pl.17 According to our data, good quality blastocyst rate did not significantly depend on the maximum volume of ooplasm in the pipette if this volume did not exceed 12 pl. However, our sample size is limited and may only show dramatic changes in the blastocyst rate. Changes in the ICSI procedure conditions since 2001 may explain this discrepancy.
Regarding the type of membrane breakage (sudden or with funnel formation), our data correlates with existing literature18: sudden breakage of the oolemma is associated with a lower fertilization rate and a higher degeneration rate. Previously, the degeneration rate was reported to be a function of oocyte quality,9 and sudden oolemma breakage was associated with small follicular size.19 However, performing ICSI with a smaller inner diameter (3–5 microns) has been shown to minimize the incidence of post-injection degeneration due to the reduction of the hole in the oolemma and mechanical trauma.20
Our clinic utilizes a one-axis movement of the needle with the help of a fine-tuning ring to minimize mechanical trauma to oocytes. This technique helps avoid expanding the hole in the oolemma and increases the chances of oocyte survival.
Limitations of the Study
While comprehensive and insightful, the study has several weaknesses that should be addressed in future research. Its retrospective design introduces potential biases and limits the ability to control for all relevant variables, which may affect the validity of its conclusions. The single-center nature of the study restricts the generalizability of the findings, as results from one clinic may not apply to other settings or populations. Additionally, the study does not account for operator variability, which could influence outcomes, and the limited sample sizes within some subgroups may reduce the statistical power to detect differences. Furthermore, focusing on short-term outcomes like fertilization and blastulation rates without considering long-term outcomes such as pregnancy rates, live births, and child health limits the overall assessment of ICSI success. Finally, the reliance on video recordings, which may vary in quality, could introduce measurement errors or biases in assessing sperm positioning and distance measurements.
In this study, we report for the first time that a cumulus cell can be dragged into the ooplasm through the zona pellucida in some cases. This phenomenon may interfere with normal development processes and be associated with abnormal fertilization. Our results underscore the clinical importance of technical details in ICSI and contribute to a better understanding of variability in ICSI outcomes between laboratories.
Our study underscores the critical role of technical parameters in intracytoplasmic sperm injection (ICSI) outcomes. We observed that the positioning of the sperm relative to the needle tip during oolemma breakage significantly influences fertilization rates. Additionally, we highlighted the importance of minimizing mechanical trauma to oocytes during the procedure. These findings emphasize the need for meticulous attention to detail in ICSI techniques to optimize clinical outcomes and ensure successful assisted reproductive treatments.
Conclusions
The blastulation rate does not differ significantly for different aspiration volumes if this volume is below 12 pl.
The probability of failed fertilization is significantly higher if the spermatozoon is near the needle bevel base when the needle is withdrawn compared to the position of the spermatozoon just behind the needle tip.
The fertilization rate decreases if the final position of sperm is in the trumpet before the needle withdrawal.
Given the possible bias due to the limited size of the groups, further investigation is needed.
Author contributions
Conceptualization: TATIANA TROSHINA (Lead). Investigation: TATIANA TROSHINA (Lead). Writing – original draft: TATIANA TROSHINA (Lead). Writing – review & editing: TATIANA TROSHINA (Lead).
Acknowledgments
Thanks M. Troshina, V. Kuzmenko. S. Korobkov, D. Zakrasina. B. Minasyan for ICSI video. Thanks to A. Sheremet, R. Belonogov, and A. Solnyshkova for embryo assessment. Also, thanks to I. Volodyaev, D. Obydniak, and G. Bazykin for discussing and editing the article.
Funding
None
Conflict of interests
None stated
The study was presented at the MKARM conference in Moscow in 2022