Introduction
In vitro fertilization (IVF) as a method became the most valuable to struggle with infertility, giving the chance to the couples to become parents.1 Despite the significant achievements in the reproductive medicine, the success of IVF cycle mainly depends on the algorithms of embryo selection with the highest potential for the blastocyst formation and implantation.1 Traditionally, the embryo scoring is based on the morphological criteria, amongst the special attention is given to the zygote scoring Z system.2
Z score, developed by Scott et al in 2000, comprises the zygote classification based on the morphological characteristics of precursor nucleoli bodies (PNB aka nucleoli) in pronuclei (the number and size of PNB and their distribution).2 This zygote scoring system was widely spread in IVF laboratories worldwide to assess an early development embryo potential.2–6 Although, despite it’s popularity, the prognostic value of Z score system in relation to the implantation and pregnancy potential is still a matter of discussion in the scientific society.6–9
The recent advancement of machine learning and artificial intelligence technologies has created new opportunities in reproductive medicine, enabling analysis of large-scale datasets and identification of underlying patterns. These computational approaches allow for simultaneous integration of multiple factors, potentially improving the predictive accuracy of embryo implantation outcomes.10,11
This study aims to provide a comprehensive assessment of Z-Score prognostic value through the lens of contemporary data analysis methods. It is crucial to clarify that this investigation is not designed as a predictive model for implantation success or IVF cycle outcomes based on pronuclear patterns. Rather, our primary objective is to conduct a systematic evaluation of analytical methodologies when applied to highly correlated embryological datasets, progressing from traditional statistical approaches to advanced machine learning techniques - including Principal Component Analysis (PCA), K-means clustering, XGBoost, and neural network ensembles. Our work specifically highlights the constraints of standard analytical methods in reproductive medicine, particularly in scenarios where researchers have access to limited, routine laboratory data. To address this, we designed a proof-of-concept study with descriptive statistics to underscore the challenges of applying conventional ML models to such contexts. The conducted data analysis could serve for the development of novel, more reliable methods for the prognosis of successful IVF cycle bringing together the traditional morphology scoring and innovative technologies.
Materials and Methods
Study Design and Population
The retrospective study included the IVF treatment cycles with embryo transfer or embryo vitrification. Programs with severe male factor infertility (n=55), vitrified oocytes (n=90), combined IVF/ICSI fertilization (n=12) and with embryo transfer (ET) earlier than day 5 (n=331) were excluded from the research. A total of 5,524 zygotes with normal fertilization were analyzed from 742 included cycles: 69 cycles with classical IVF and 673 with ICSI.
Laboratory Protocols
The oocyte/embryo culture was conducted in a Sage 1-Step HSA medium till day 6 under 5.9-6.1% CO₂, 5% O₂ at 37°C. The fertilization and blastocyst stage Day 5 and Day 6 were assessed at 17±1, 116±1 and 140±1 hour respectively under the objectives 20X and 40X on inverted microscope (Olympus IX73). The clinical pregnancy rate was considered the established pregnancy with at least one gestational sac confirmed with ultrasound diagnostics at 6-8 weeks post embryo transfer.
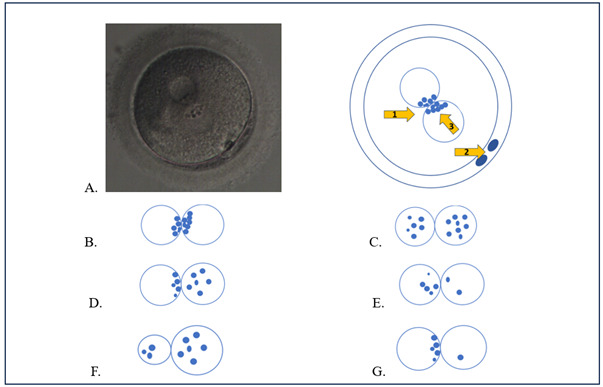
A human zygote (aka fertilized egg) presents round-shaped cell with two pronuclei (one maternal, one paternal) predominantly located in the center of cytoplasm and two polar bodies in the perivitelline space (PVS).12 PNB are located within pronuclei and their presence is pivotal for the synthesis of pre-rRNA for future protein translation at the time of active embryonic genome.13
Morphological Assessment
The morphological features of zygote patterns were graded using an adapted Z-Score system (Fig.1).2 According to it, the zygotes were classified as follows: “Z1” –relatively the same size of two pronuclei (male and female), the presence of at least 3 PNB (≥3) in each pronucleus and aligned at the pronuclear junction; “Z2” – analogous to the “Z1” pattern, but with the dispersed PNB distribution in both pronuclei; “Z3” - analogous to the “Z2” pattern, with dispersed PNB only in one pronucleus and another pronucleus with nucleoli alignment at the pronuclear junction; “Z4” - relatively the same size of two pronuclei with the presence of 2 PNB in one of them; “Z5” – the different size of pronuclei (the difference > 20%) or one of the pronuclei with 1 PNB. Gardner et al. classification was used for the blastocyst grading,14 3BB and higher grades were considered the blastocysts of good quality.

The fertilization rate for each Z-score category (Z1–Z5) was calculated as the proportion of all mature (MII) oocytes that resulted in normally fertilized zygotes (2PN) and were assigned to the corresponding Z-score group. This approach reflects the relative distribution of Z-score categories among all fertilized oocytes, rather than the fertilization efficiency within each Z-score category.
Statistical and Machine Learning Analysis
For machine learning and statistical modeling implementation the Python 3.11 programming language and the Scikit-learn 1.5.0 library in DataSpell 2024.2 IDE were used. The Datalore 2024.2 software was applied for the descriptive statistics. Multiple linear regression analysis was performed using ordinary linear squares (OLS). To ensure rigorous validation, the dataset was partitioned into training (80%) and testing (20%) subsets using Scikit-learn’s train_test_split function. For XGBoost those hyperparameters were chosen: colsample_bytree: 0.8, learning_rate = 0.001, max_depth = 7, n_estimators = 3000, reg_alpha = 1, reg_lambda = 0.0001, subsample = 0.9.
The deep learning neural network (DNN) model has been developed and executed in the GPU PyCharm 17.0.10 environment with the Tensorflow 2.15.0 and Keras library 2.14.0 as a sequential Recurrent Neural Network (RNN) consisting of two layers (SimpleRNN with 32 and 16 neurons with Rectified Linear Activation - ReLU) with L2 and L1 regularization to control overfitting by adding penalties to the model’s weights, dropout layer to prevent model overfitting by randomly excluding 20% of neurons during training and with the final dense output layer with one neuron and sigmoid activation. The Kolmogorov-Arnold networks (KAN) were constructed with Pykan package version 0.2.1 and consisted with 2 neuron layers (10 and 1 neurons with linear activation and grid = 5). Both models were combined with stacking approach in final DNN-KAN metamodel with Adam optimizer and learning rate = 0.00001 on training execution. The final model was calibrated with Venn-Abers method of conformal prediction with Python package venn-abers 1.4.5 to obtain probabilities of pregnancy achievement from neural networks predictions. The model was pretrained on a data for pregnancy probability prediction as described in the work of Sergeev and Diakova.10
A p-value of < 0.05 was considered statistically significant. The groups comparison on quantitative indicators was carried out using multivariate analysis of variance (ANOVA) followed by Tukey HSD test for established significant differences. The normality of the variable distribution was assessed using the Shapiro-Wilk test. Normally distributed quantitative indicators were described along with mean and standard deviation (SD) and 95% confidence interval (CI). The non-normally distributed variables were analyzed by means of median and interquartile range. The analysis of statistical significance of correlation relationships was performed using the Pearson coefficient. The analysis of multiple linear regression results included an assessment of errors and R² determination coefficient with an assessment of the mean square error (MSE) and mean absolute error (MAE).
Results
Study Population Characteristics
A retrospective analysis of 742 IVF cycles was conducted using adapted Z-score grading system for zygote assessment. The age composition of the study group was 34.39 ± 5.86 years, ranging from 21 to 61 years, indicating a predominantly young but heterogeneous cohort of patients. The median age was 34 years, with the quartile distribution showing that 25% of participants were under 30 years old, and 75% were under 38 years old, while only 5% exceeded the age of 45.
Quantitative parameters of oocyte-cumulus complexes (OCCs) were evaluated, with values ranging from 0 to 60 and a mean of 12.74 ± 6.98. The interquartile range was characterized by a quarter of patients having less than 8 OCCs, while 75% were found to have more than 16 OCCs. Mature oocytes (MII stage) were analyzed, revealing a mean of 9.26 ± 4.95, with a range of 1 to 37 and a median of 8, where 75% of patients were observed to have no more than 12 mature oocytes. Two-pronuclear (2PN) zygotes were quantified, with a mean of 7.45 ± 4.36, ranging from 1 to 31 and a median of 6; three-quarters of patients were found to have less than 10 zygotes, and a quarter had no more than 4 zygotes (Table 1).
Z-Score Distribution and Laboratory Outcomes
The differentiated analysis of zygote distribution according to the Z-score categories showed a predominance of Z2 and Z3 categories, with mean values of 2.88 ± 3.05 and 3.93 ± 3.56, respectively, while the Z1, Z4, and Z5 categories were less represented. The evaluation of quantitative parameters for blastocyst formation confirmed the superior potential of the Z2 and Z3 categories in successful IVF laboratory outcomes, with mean numbers of developed blastocysts of 1.96 ± 2.33 and 2.73 ± 2.76, respectively. A similar trend was observed for high-quality blastocysts (3BB and above), with mean values of 1.14 ± 1.61 for the Z2 category and 1.59 ± 1.89 for the Z3 category. Lower blastocyst formation rates were demonstrated across other patterns: in the Z1 category, a mean of 0.13 ± 0.46 was observed, with a maximum of 5; in Z4, the mean was 0.07 ± 0.30 with a maximum of 4; for the Z5 (BN/SN) category, a mean of 0.02 ± 0.14 was found; and for the Z5 (1 nucleolus) category, a mean of 0.00 ± 0.07 was recorded.
For the calculation of key performance indicators (KPIs) for the laboratory, the Vienna consensus criteria were used.15 When evaluating these indicators for each of the selected Z-score groups, the following data were obtained on the proportions of zygotes with different pronuclear patterns for average fertilization rates: Z1 (0.18 ± 0.11), Z2 (0.40 ± 0.32), Z3 (0.54 ± 0.24), Z4 (0.14 ± 0.09), Z5 (BN/SN) (0.12 ± 0.09), and Z5 (1 nucleolus) (0.12 ± 0.05). The proportions of Z1, Z2, Z3, Z4, and Z5 zygotes among all fertilized oocytes were 0.04, 0.38, 0.52, 0.02, and 0.01, respectively. Similarly, the rates of blastocyst formation and high-quality blastocyst formation were calculated, which were 0.77 ± 0.35 and 0.54 ± 0.41 for Z1, 0.72 ± 0.32 and 0.48 ± 0.38 for Z2, 0.72 ± 0.27 and 0.46 ± 0.29 for Z3, 0.69 ± 0.44 and 0.45 ± 0.47 for Z4, and 0.37 and 0 for Z5, respectively.
Statistical Analysis Results
The conducted multifactorial ANOVA analysis revealed statistically significant differences between fertilization rates in the various Z-score groups (F-statistic = 107.831, p<0.00001), while no significant differences were found in the blastocyst formation and high-quality blastocyst formation rates (F-statistic = 1.332 and 1.544, p>0.05, respectively). The study identified the most pronounced positive correlations between the number of Z2 and Z3 zygotes and the number of developed blastocysts, where the correlation coefficient reached 0.472 for the Z2 category and 0.620 for the Z3 category. This trend also persisted for high-quality blastocysts, with correlation coefficients of 0.373 for Z2 and 0.510 for Z3. The Z1, Z4, and Z5 categories demonstrated significantly lower and statistically insignificant (p>0.05) correlations with the number of blastocysts.
The analysis of the statistical significance of correlations using Pearson’s correlation coefficient confirmed the statistical reliability of most of the identified correlations (p<0.05), with the strongest and most statistically significant correlations observed between the number of Z2 zygotes and the number of blastocysts (r=0.908, p<0.0001), as well as between the number of Z3 zygotes and the number of Z3 blastocysts (r=0.897, p<0.0001). It is worth noting the observed negative correlation between the number of Z3 zygotes and the number of Z3 blastocysts (r=-0.223, p<0.0001), and a similar trend was observed between age and the number of Z5 (BN/SN) zygotes (r=-0.087, p=0.017). The quantitative parameters of MII oocytes and OCCs demonstrated moderate positive correlations with the number of Z2 zygotes (r=0.494 and r=0.452, respectively, p<0.0001), confirming the importance of stimulation quality, as determined by the yield of mature oocytes, for obtaining fertilization-competent oocytes.
Multiple Linear Regression Analysis
As part of this study, we applied the multiple linear regression method to assess the impact of the Z-score assessment system on the outcomes of the IVF program, particularly on the number of implanted embryos for different zygote assessment patterns. This method was chosen based on a preliminary analysis of the multicollinearity of the data, which allowed us to account for the interrelationships between the different Z-score zygote assessment categories. The multiple linear regression model was constructed with the number of gestational sacs as the dependent variable, while the independent variables were the number of zygotes in each Z-score category (Z1, Z2, Z3, Z4, Z5 (BN/SN), Z5 (1 nucleolus)), as well as the total number of 2PN zygotes.
The additional analysis of multiple linear regression results, including the assessment of errors and coefficients of determination for various Z-score zygote categories in the context of their relationship with the number of high-quality blastocysts, demonstrated a variable degree of explanatory power of the models for different Z-score categories. The maximum coefficient of determination (R²) was recorded for the Z3 pattern, reaching a value of 0.264, indicating that this category can explain approximately 26.4% of the variability in the number of high-quality blastocysts, while for the Z2 pattern, the coefficient of determination was 0.140, demonstrating a less pronounced but still definite prognostic value. The Z4 and Z5 (BN/SN) patterns were characterized by significantly lower R² values (0.019 and 0.036, respectively), indicating their limited prognostic significance in relation to the formation of high-quality blastocysts. The assessment of Mean Squared Error (MSE) and Mean Absolute Error (MAE) revealed the highest values of these indicators for the Z2 and Z3 categories (MSE = 2.226 and 2.628; MAE = 1.092 and 1.257, respectively), suggesting the inadequacy of the applied regression assessment of blastocyst yield based on pronuclear patterns.
Systematic comparison between OLS, Ridge regression, and Elastic Net methods reveals that even regularization techniques show minimal improvement (R² differences < 0.01), indicating that the underlying data structure requires more sophisticated approaches.
The conducted regression analysis demonstrated a relatively low predictive value of the model, as evidenced by the lack of statistically significant coefficients for most Z-score patterns. However, certain statistically reliable patterns were identified. Notably, the most significant predictor of successful completion of the IVF protocol was the number of zygotes in the Z5 (BN/SN) category, which showed a positive correlation with the number of implanted embryos (coefficient = 0.0354, p = 0.001). This represents an unusual finding, considering the traditional association of the Z5 category with a less favorable prognosis, and potentially indicates the possibility of successful implantation even for zygotes with suboptimal morphology. The correlations between the number of implanted embryos and the zygote categories were characterized by weak but statistically significant associations (for Z2: r=0.134, p<0.0001; for Z3: r=-0.138, p<0.0001), indicating the limited ability to predict implantation based solely on the morphological characteristics of pronuclei (Table 2).
A significant limitation of the analysis was the inability to obtain reliable estimates for the Z5 (1 nucleolus) pattern, where all coefficients and statistical indicators were indeterminate, which is likely due to the insufficient representation of observations in this category. For the other Z-score patterns, including Z1, Z2, Z3, Z4, and Z5 (BN/SN), as well as for the total number of 2PN zygotes, no statistically significant correlations with the number of gestational sacs were found (all p>0.05). The constant of the model (0.0036) also did not demonstrate statistical significance (p=0.337), suggesting the absence of a baseline level of implantation independent from the morphological characteristics of the zygotes. Analysis of the distribution of the model residuals revealed certain deviations from normality (Omnibus test: 1625, p<0.0001; Jarque-Bera test: 3611689, p<0.001), indicating the need for a critical approach to the interpretation of the obtained results and the potential usefulness of applying more complex statistical methodologies.
Machine Learning Analysis
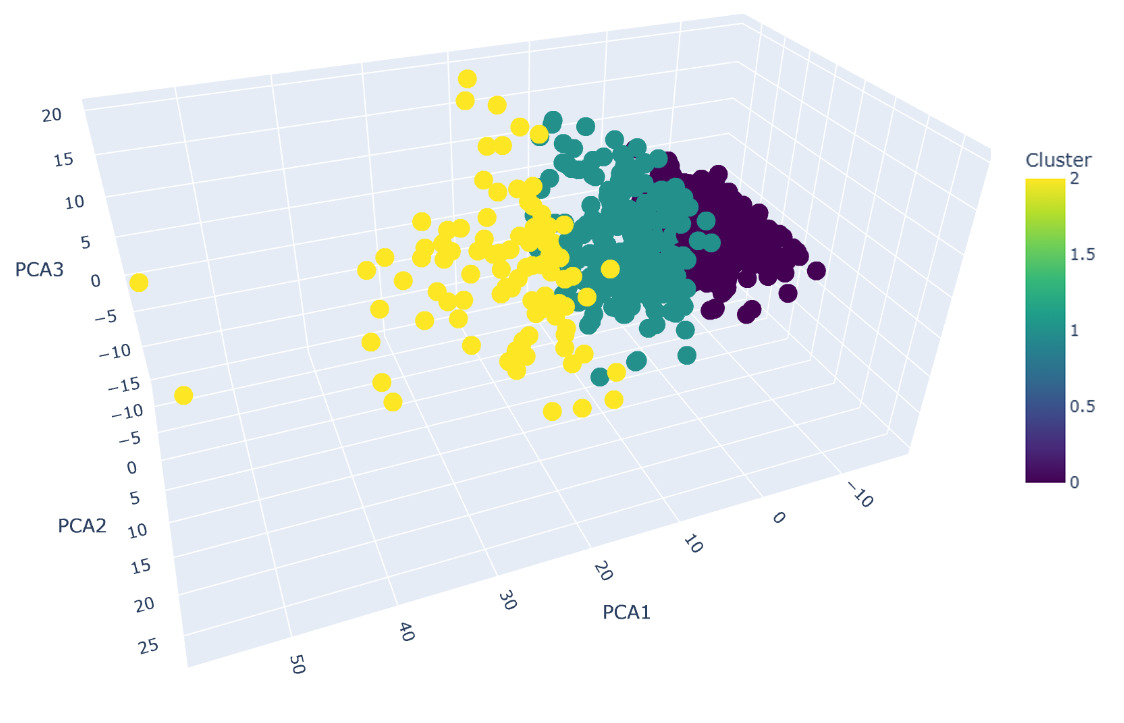
Further research was based on independent machine learning algorithms with PCA dimensionality reduction. Cluster analysis of the data using PCA and K-means methods allowed the embryos to be divided into three groups, which reflect differences in the qualitative and quantitative characteristics of oocytes, blastocysts, and embryos at various stages of development (Fig.2). Our PCA analysis demonstrates that the first three principal components explain 89.88% of the total variance in the dataset (PC1: 56.55%, PC2: 20.20%, PC3: 13.13%). This exceeds the commonly accepted threshold of 80-85% for dimensionality reduction in the research, ensuring that our visualization retains the vast majority of information content while enabling interpretable 3D representation of embryo clusters. To ensure methodological rigor in cluster number selection, we implemented four established validation metrics. The silhouette analysis identified k=2 as statistically optimal with a coefficient of 0.2698, indicating moderate but acceptable cluster separation for biological data where natural boundaries are typically less distinct than in artificial datasets. This finding was corroborated by the Calinski-Harabasz index, which peaked at k=2 with a score of 94.84, confirming well-defined separation between cluster centroids. However, the Davies-Bouldin index suggested k=8 as optimal (score: 1.1664), while the elbow method failed to identify a clear inflection point, reflecting the gradual nature of biological clustering boundaries rather than sharp transitions. Considering the combined evidence from multiple indices and silhouette visualization, k = 3 was selected as the most balanced solution, reflecting adequate separation and biological interpretability of clusters.

Cluster 0 was characterized by the lowest number of embryos and oocytes across all groups. The mean patient age in this cluster had been determined to be 34.39 ± 5.23 years. The cluster was distinguished by reduced numbers of mature oocytes (MII = 5.83 ± 1.99) and 2PN zygotes (4.53 ± 1.76). Among all three clusters, the minimal number of blastocysts of all quality grades was observed in this group. Cluster 1 was defined by the highest number of embryos and oocytes. A mean patient age of 34.76 ± 8.04 years had been recorded in this group. The cluster was marked by elevated numbers of mature oocytes (MII = 18.77 ± 4.84) and 2PN stage zygotes (15.67 ± 4.49). The maximum number of blastocysts was found in this cluster. Cluster 2 was positioned intermediately between clusters 0 and 1 across all parameters. A mean patient age of 34.26 ± 5.96 years had been documented in this group. The numbers of mature oocytes (MII = 11.41 ± 2.30) and 2PN stage embryos (9.24 ± 2.36) were found to be intermediate between the values observed in clusters 0 and 1 (Table 3).
Neural Network Performance
Using a neural network model, the possible clinical pregnancy rates (CPR) were calculated for each of the Z patterns. Comparing them to the actual pregnancy rates, the following results were obtained: Z1 - predicted CPR = 32.17%, actual CPR = 27.31%; Z2 - predicted CPR = 36.72%, actual CPR = 28.20%; Z3 - predicted CPR = 39.06%, actual CPR = 29.53%; Z4 - predicted CPR = 27.59%, actual CPR = 27.48%; Z5 - predicted CPR = 23.64%, actual CPR = 28.57% (Table 4).
Discussion
Principal Findings
The initial exploratory data analysis was conducted using descriptive statistics to evaluate the distribution of quantitative parameters in the dataset. The obtained distributions in zygote patterns may indicate variability in ovarian stimulation response among the IVF cycles, with a relatively conservative mean patient age (34 years) and moderate stimulation response in the study group.
Z Score assessment of zygotes revealed that Z2 and Z3 patterns zygotes demonstrated the highest potential for further development into blastocysts and good quality blastocysts, giving the highest chances for the pregnancy achievement. KPI analysis, according to the Vienna Consensus,15 showed stability in laboratory parameters for blastocyst formation rate and good quality blastocyst rate. Across all zygote patterns, the achieved values for these KPIs were above the consensus benchmark level, with confidence intervals remaining within competency levels in half of the cases. In zygote formation, the majority were classified as Z Score Z3 pattern, while Z5 pattern was the least common. Among the selected KPIs, only the fertilization rate showed significant differences (p <0.05) between zygote groups with different Z scores.
Z-Score System Limitations
We observed that zygotes classified as Z2 and Z3 on the Z Score scale possess the highest developmental potential to reach the blastocyst stage, including development into good quality blastocysts. These findings may have important implications for predicting IVF success and selecting embryos for transfer.16 However, it should be noted that other factors, such as patient age and individual response characteristics to ovarian stimulation, may influence the outcomes.6,17
The results of the correlation analysis significantly expand upon previous observations regarding the preferential potential of Z2 and Z3 patterns zygotes as the most promising candidates for further development. This is supported by strong positive correlational relationships between these categories and quantitative indicators of blastocysts, including good quality blastocysts, which may have substantial practical significance for embryo selection in IVF programs.18 The identified weak negative correlations with patient age parameters emphasize the necessity of considering age when predicting treatment effectiveness17; however, their significance is mitigated by the relative age homogeneity of the studied cohort. The discovered positive correlations with quantitative indicators of mature oocytes and oocyte-cumulus complexes suggest a potential relationship between a more pronounced stimulation response and the possibility of obtaining a greater number of zygotes, which may indicate the optimality of the applied total dosages of superovulation induction medications.19 Nevertheless, it must be emphasized that the presence of correlational relationships does not imply causation, and the calculated MAE and MSE values exceed the model’s acceptable application limits, indicating the need for more detailed analysis of the statistical significance of identified correlations to form a deeper understanding of the parameter interactions.
Multicollinearity Issues
The phenomenon of multicollinearity, where independent variables in the model correlate with each other, can significantly complicate the evaluation of their impact on program outcomes, leading to unstable regression coefficient estimates and increased standard errors. The VIF assessment results in our study revealed multicollinearity issues, particularly among variables related to 2PN count, where VIF values significantly exceeded the threshold level of 10 for 2PN and Z1-Z4 parameters, while for the number of implanted embryos, VIF values ranged from 1.06 to 1.39, indicating no significant multicollinearity problems for these indicators. The VIF analysis not only helped identify existing issues, but also laid the foundation for their subsequent resolution through the exclusion of highly correlating variables or the application of regularization methods in model construction, ultimately contributing to improved reliability and interpretability of research results. The obtained results of the multiple regression model with multicollinearity assessment demonstrated that morphological evaluation of zygotes using the Z Score scale has limited predictive value regarding embryo implantation.
The severe multicollinearity observed in our dataset (VIF > 10 for most variables) reflects the inherent biological reality of embryonic development, where multiple morphological parameters are intrinsically interconnected. Rather than representing a statistical flaw to be corrected, these intercorrelations constitute the fundamental analytical challenge that our methodological framework aims to address. Our comparative analysis of regularization techniques (Ridge: R² = 0.0072-0.0661; Elastic Net: R² = 0.0000-0.0401) versus OLS (R² = 0.0084-0.2163) demonstrates that conventional solutions to multicollinearity provide limited benefit for this type of biological data, supporting our progression to more advanced methodological approaches.
Anomalous Findings
The positive association between Z5 (BN/SN) category and implantation outcomes (coefficient = 0.0354, p = 0.001) represents an unusual finding, considering the traditional association of the Z5 category with a less favorable prognosis. This observation indicates a possible potential of zygotes with less optimal morphology for successful implantation, and the very nature of PNB positioning and morphology cannot be used as an independent method of embryo selection.7,9,20 This finding contradicts established biological understanding and likely represents either a dataset-specific anomaly or the influence of unmeasured factors affecting the small Z5 population.
Machine Learning Insights
The application of PCA-based cluster analysis and K-means allowed us to group embryos according to similar characteristics, such as the number of mature oocytes, and the quantity and quality of blastocysts. This approach enabled the evaluation of the obtained data on embryo development and implantation potential in the IVF treatment, not from the standpoint of describing the morphological pattern of zygotes, but from an alternative position of feature dimensionality reduction to assess their real predictive significance for the treatment cycle outcome.21 The reduction of dimensionality, while preserving the main sources of variation, is especially important for complex biological data with multiple correlated variables characteristic of our dataset.22
The K-means method, in turn, allows the clear division of data into groups based on key features, without relying on pre-established threshold values. The choice of clusters is justified by the results of the multivariate analysis, which included not only the assessment of individual indicators, but also the relationships between them. This approach allows for a comprehensive view of the problem and the identification of groups of embryos with different implantation potentials. This is what makes such clustering an independent machine learning method21 and offers an alternative approach to the classification of zygotes and embryos, considering all available data on their in vitro development.
Our stability analysis validates this decision, demonstrating robust cluster assignments with a mean silhouette score of 0.2434 ± 0.0150 across 30 random initializations and a coefficient of variation of only 6.15%. This low variability confirms the reproducibility of our clustering solution and indicates that the identified embryo subgroups represent genuine patterns rather than artifacts of initialization or algorithmic instability. The final clustering solution reveals three distinct embryo populations: a dominant group comprising 68.7% of embryos (n=510 cycles), a secondary group representing 28.2% (n=209 cycles), and a smaller but distinct subpopulation accounting for 3.1% (n=23 cycles). The small third cluster, while representing a minority of embryos, likely captures a specialized subpopulation with unique morphological characteristics that would be masked in a simpler k=2 solution. The biological validity of our k=3 clustering is supported by the moderate Adjusted Rand Index of 0.3789 with our initial clustering approach, suggesting that our validation process has refined rather than fundamentally altered our original embryo stratification. This level of agreement indicates consistency in the underlying biological patterns while demonstrating the value of rigorous validation in optimizing cluster boundaries. The identified clusters exhibit meaningful differences in embryological parameters that align with known biological processes and treatment response patterns, supporting their potential utility in personalized medicine approaches. The selection of k=3 over the statistically preferred k=2 reflects the principle that in clinical research, biological plausibility should inform statistical decisions. While k=2 maximizes certain clustering metrics, k=3 provides clinically interpretable subgroups that capture important biological heterogeneity.
The interpretation of the clustering results (Fig.2) allows us to draw the following conclusions. The identified clusters reflect differences in the quantity and quality of the obtained oocytes and embryos. Cluster 1 represents the group with the most favorable indicators, which may be associated with a higher ovarian reserve of patients or more effectively selected ovarian stimulation. Cluster 0, on the contrary, is characterized by the least favorable indicators, which may indicate a reduced ovarian reserve or a suboptimal response to stimulation. Interestingly, the average age of patients in all three clusters is almost identical (around 34 years), indicating that age is not a determining factor in this clustering model. This underscores the importance of individual characteristics of the reproductive system and the response to ovarian stimulation.23
Cluster analysis demonstrated that the distribution of zygotes with different Z scores varies across clusters. Cluster 1, which is characterized by the greatest embryo implantation potential, showed the highest proportion of zygotes with high Z scores (e.g. Z1 and Z2), indicating a possible link between a higher pronuclear pattern and successful embryonic development, confirming the importance of the qualitative characteristics of the zygote for further embryonic development. It is consistent with the classical understanding of the Z-score.2 Cluster 0, on the other hand, is characterized by a suboptimal pronuclear pattern, with a higher proportion of zygotes with lower Z scores (e.g. Z3 and Z4), which may be associated with these zygotes less frequently developing into high-quality blastocysts and having a lower probability of successful implantation. Cluster 2 represents an intermediate group, with zygotes exhibiting both more favorable (Z1 and Z2) and less favorable (Z3 and Z4) Z scores. These zygotes have a moderate potential for blastocyst development and implantation. Based on the results of the analysis, it is possible to combine some Z-score gradations (Z1 with Z2 and Z3 with Z4) with a final number of divisions not exceeding three. The similar approach was demonstrated in Istanbul consensus.24
The application of unsupervised machine learning techniques, specifically PCA and K-means clustering, was motivated by the need to critically evaluate the Z-score system—a widely adopted yet debated morphological assessment tool. While traditional Z-score categorization relies on static, fixed-timepoint observations of pronuclear morphology, our analysis revealed its inherent limitations in predicting developmental outcomes. Regression models demonstrated weak correlations between individual Z-score categories and implantation success, underscoring the system’s fragmented prognostic utility. To address this, we employed PCA to reduce dimensionality and uncover latent patterns within the dataset, followed by K-means clustering to objectively stratify embryos based on combined morphological and clinical parameters. This approach diverged from conventional biological discovery goals; instead, it aimed to automate and refine routine embryological assessments by integrating quantitative, lab-documented variables.
Notably, PCA revealed that collapsing Z-score categories into broader groups (e.g., merging Z1-Z2 and Z3-Z4) aligned more closely with developmental potential than the original five-tier classification. For instance, Cluster 1, associated with the highest implantation rates, was dominated by zygotes with Z1/Z2 patterns, while Cluster 0, characterized by poorer outcomes, showed a higher prevalence of Z3/Z4 zygotes. These findings suggest that traditional granular Z-score classifications may overemphasize subtle morphological differences while neglecting systemic interactions between variables. By contrast, unsupervised learning highlighted hidden associations—such as the interplay between Z-score distribution and stimulation response—that are imperceptible to manual scoring.
Future studies should expand this approach by integrating dynamic data (e.g., time-lapse imaging) and molecular biomarkers to further refine predictive models. Nevertheless, our results emphasize that even routine clinical data, when analyzed through innovative computational lenses, can challenge entrenched practices and pave the way for more robust, data-driven embryological workflows.
Neural Network Performance
The neural network models can serve not only as a tool for predicting success, but also as an important element of quality control in the laboratory, and their integration with clustering methods, PCA, and Z-score analysis opens new horizons in predictive analytics in the field of reproductive medicine. These approaches will allow for more accurate assessment of the chances of successful implantation of specific embryos, providing a high level of personalization and control over the results.25
The results obtained using the neural network model showed the predicted CPRs for each Z-score category, which were compared to the actual rates. For zygotes with Z1, Z2, and Z3 patterns, the model predicted higher CPR than the actual (Z1 - 32.17% predicted vs. 27.31% actual, Z2 - 36.72% vs. 28.20%, Z3 - 39.06% vs. 29.53%), indicating a possible overestimation of the predictive value of zygotes in these categories. However, for zygotes with Z4 and Z5 patterns, the model’s predictions were closer to the actual CPR (Z4 - 27.59% predicted vs. 27.48% actual), and in the case of Z5, the model underestimated the actual CPR (23.64% predicted vs. 28.57% actual). This result may indicate that zygotes with less optimal morphological characteristics, as in the case of Z5, have hidden potential for successful implantation, which the model does not fully account for.
The overall actual clinical pregnancy rate was 34.52%. Using historical data on pregnancy rates in fresh cycles in our clinic, we formed a prior probability distribution, which was then refined through the ensemble of neural network models, leading to the posterior distribution in the Bayesian method with a certain confidence interval. Using this model, the mean probability of embryo implantation with different pronuclear patterns was estimated to be 0.39, with a 95% confidence interval (0.35 - 0.43). This interval includes the actual pregnancy rate, confirming the accuracy of the model and its ability to adequately reflect the dynamics of the results without additional methods of zygote morphological assessment.
A notable finding is the discrepancy between predicted and actual clinical pregnancy rates (CPR) for zygotes classified under Z1-Z3 patterns. This overestimation underscores two critical considerations in applying ML to embryological data: Z1-Z3 zygotes constituted the majority of our dataset - the KAN-DNN model inherited biases toward prevalent patterns, leading to inflated predictions for dominant categories that could be more heterogeneous than present in existing classification due to the fact that Z-score system evaluates pronuclear morphology at a fixed timepoint, ignoring dynamic developmental processes (e.g., cleavage kinetics, metabolic shifts) that influence implantation potential.26
These discrepancies emphasize the different implantation abilities of blastocysts obtained from zygotes of different Z-scores, however, the division in this assessment system into 5 categories is most likely not justified. Taking into account the neural network model’s probability of pregnancy and the actual data, it is possible to combine the Z1, Z2, and Z3 patterns into one group of promising zygotes, and the Z4 and Z5 patterns into another, less promising group. Such a grouping division of pronuclear morphological characteristics into only two categories appears most justified in terms of pregnancy rate assessment.
Study Limitations
Several limitations must be acknowledged in this study. The retrospective design introduces inherent selection bias, particularly through the exclusion of early embryo transfers and combined IVF/ICSI cycles. The exclusion criteria may systematically remove cases where early transfer was clinically indicated, potentially skewing the population toward better responders. The use of clinical pregnancy assessment at 6-8 weeks post-transfer, while standard in reproductive medicine, is less clinically relevant than live birth rates, which represent the gold standard for IVF prognostic studies.
The severe multicollinearity between Z-score categories (VIF >10) complicates interpretation of individual category effects and indicates potential redundancy in the current classification system. The relatively small representation of Z1, Z4, and Z5 categories (6% combined) limits the robustness of machine learning predictions for these groups. Additionally, the single-timepoint morphological assessment cannot capture the dynamic nature of early embryo development.
The anomalous positive association between Z5 (BN/SN) category and implantation outcomes contradicts established biological understanding and requires cautious interpretation. This finding may represent dataset-specific anomalies, confounding variables, or the influence of unmeasured factors affecting the small Z5 population. Moreover, Z5 (BN/SN) does not really represent PNB patterning, but reflects the size difference (>20%) between the pronuclei. Therefore, Z5 (BN/SN) could theoretically account for any PNB pattern within pronuclei. The purpose of analyzing size difference of pronuclear morphology was to understand whether it influences the outcome. However, a single static observation is not effective and accurate considering that pronuclei tend to enlarge in size progressively reaching their final size before nuclear envelope breakdown (NEBD).27 Considering above-mentioned and that proportion of overall Z5 is just 1% on the scale, we would recommend to exclude Z5 (BN/SN) from clinical decision-making.
We acknowledge that the employment of these pre-existing algorithms represents both a strength and limitation of our approach. While the models benefit from extensive clinical validation and proven performance, they were not optimized specifically for the research questions addressed in this study. Future work will involve developing task-specific architectures that better align with the static nature of pronuclear morphology data, potentially incorporating convolutional layers for spatial feature extraction or attention mechanisms for selective feature weighting.
The current study’s primary contribution lies in the clustering analysis and biological interpretation rather than methodological innovation in machine learning architecture. The neural network and boosting algorithms serve as validation tools to confirm the biological relevance of our identified patient subgroups rather than as novel predictive models. This approach ensures that our clustering results can be translated into clinically actionable insights using established, validated computational frameworks already integrated into our laboratory workflow.
Clinical Implications
This study was conducted including ML approaches to address the feasibility of Z-score assessment. Based on our findings, we recommend simplified Z-score classification. It could be combined as Z1/Z2 and Z3/Z4 categories supported by the clustering results in terms of embryo development potential. We would also suggest that Z5 (1 nucleolus) can be classified as a third separate group, representing the least favorable pattern for embryo development, which is consistent with the initial Istanbul Consensus.24 This pattern is rare, making it challenging to obtain a sufficient amount of data for analysis. The blastocyst formation rate thereof is 0.00 ± 0.07. However, according to our longstanding observational experience, the prognostic significance of this pattern may still hold value, particularly in the cases of embryo transfer before day 5.
It is well-known that embryo evaluation and ranking is critical to the success of embryo selection for the transfer. Due to low TLT affordability, a number of clinics mainly rely on conventional embryo grading. The potential of pronuclear morphology assessment was unlocked by cluster analytics and applying it into the routine IVF practice could serve as an additional non-invasive, efficient and cost-effective tool to further assist embryo ranking and selection of an embryo with the highest implantation potential. Moreover, there is a changing trend in the IVF laboratories with a huge workload to only assess the fertilization and the blastocyst stage. In this case scenario, Z-score assessment could serve as a valuable tool to address the competency of fertilized eggs to reach the blastocyst stage, especially good quality blastocysts. To further address the competency of an oocyte, our findings demonstrate that Z1 and Z2 patterns are predominantly in the good responder group, which implies, usually, young patient cohort. It could be suggested that PNB patterning could serve as a biomarker of an oocyte competency to progress to the blastocyst stage. Finally, we propose that these findings could also apply to early transfers scenarios when the decision has to be made based on embryo grading at cleavage stage, which is far less reliable in comparison to the blastocyst grading and selection.
However, the latest findings suggest that embryo selection strategies should move beyond single-parameter assessment toward integrated approaches combining morphological, temporal, and molecular markers. The TLT morphokinetics systems that have gained clinical acceptance27–32 may offer superior predictive accuracy by capturing dynamic developmental processes rather than static morphological snapshots. Barberet and co-authors29 focused on 35 morphometric, morphologic and morphokinetic variables to address their influence on live birth outcomes. Their results demonstrated no effect of PNB patterning, but the position of PN at time of PN juxtaposition and the lack of multinucleated blastomeres (MNB) at the 2-cell stage were positively associated with live birth in young patient group.29 Other researchers also analyzed a number of morphokinetic parameters and discovered that timings for the 2nd polar body extrusion, pronuclear fading and length of S-phase were associated with embryo implantation.33 PNB patterning was also investigated in relation to the implantation potential and no link was found.33 However, Aguilar and coauthors33 recommend to evaluate the Z-score morphology right before nuclear envelope breakdown (NEBD) when the PN are the largest to accurately assess pronuclear patterns, which is solely possible employing TLT. Interestingly, the highest proportion of Z1 pattern was recorded in the cohort considering the use of the donor eggs in their study.33 Our findings also demonstrate the highest proportion of favorable Z1 and Z2 scores in the good responder group in the cluster analysis [Table 3]. Since the good responder group implies young age group, it is suggested that Z1 score is associated with greater chances to reach the blastocyst stage and, therefore, to potentially increase the clinical outcome. This latter assumption could be supported by the study of Cavazza and coauthors32 who analyzed the PNB distribution. Their results demonstrate that progression and clustering of nucleoli at the interface of the two pronuclei at the time of NEBD is strongly related to the blastocyst development.32 Other studies on morphokinetic aspects of nucleoli demonstrate that PNB speed migration exert an effect on embryo ploidy status and live birth.30,31 The zygotes with the fastest PNB migration speed in both male and female PNi tend to develop into the blastocysts.30,31
The above-described literature data points out that the conventional grading systems on pronuclear scoring, early cleavage, embryo morphology at standard time points have limitations. A single observation of pronuclear morphology demonstrates high variability and a single static observation of PNB patterning may be misleading in relation to the fate of an embryo.30,34 Moreover, the discrepancies that exist at inter- and intra-operator level could lead to economic burdens and reputation costs of the IVF clinic.35 TLT, in its turn, offers far beyond a greater number of morphokinetic parameters to be assessed during early embryo development and even more, to be automatically graded with implementation of AI-driven software.26 Thus, revision of grading systems was done with emphasis on time lapse imaging.27 The recent Istanbul Consensus Update supported by the numerous TLT studies underscores the inconsistencies regarding the benefit of pronuclear morphology assessment.27 Furthermore, the static observation of PNB in pronuclei is not recommended due to its dynamic nature.27,30–32 Finally, the use of PNB patterning as a biomarker for embryo development still remains unclear and complicated.27
Future Research Directions
Future investigations should focus on dynamic assessment integration combining Z-score with time-lapse morphokinetics, molecular marker incorporation including metabolomics and proteomics profiles, and prospective validation studies with live birth outcomes and larger diverse populations. Cost-effectiveness analysis for clinical implementation and investigation of simplified Z-score categorization systems would also be valuable.
Conclusion
Our study demonstrates that although the Z-score system captures key aspects of pronuclear morphology, its predictive value for embryo implantation is limited. Regression and correlation analyses confirmed that only Z2 and Z3 categories consistently showed meaningful associations with blastocyst formation, while other categories had negligible prognostic utility. The unexpected positive association observed for certain Z5 embryos is likely a dataset-specific anomaly, highlighting the need for cautious interpretation of rare patterns.
By applying PCA, K-means clustering, and neural network ensembles, we illustrate that grouping Z-score patterns into simplified categories can improve predictive consistency and provide a more practical framework for IVF laboratories. This approach aligns with prior consensus recommendations to refine morphological scoring and underscores the importance of multidimensional embryo assessment.
Clinically, these findings support moving beyond static morphology toward integrated models that combine pronuclear evaluation with time-lapse morphokinetics, molecular profiling, and robust ML pipelines. Future prospective studies should validate these approaches with live birth as the primary endpoint, assess generalizability across diverse patient populations, and evaluate cost-effectiveness for clinical implementation.
Acknowledgements
All the authors made their substantial contribution being actively involved in the research process, from study design to manuscript revision. All the authors are in full agreement with the content of the submitted manuscript.
Disclosure Statement
The authors declare that there are neither commercial nor financial nor personal interests related to the publishing of this manuscript or its content.
Ethics Statement
The protocol for the research project (retrospective study) has been approved by the Local Ethics Committee (IRB 00013497) of the National Research Institute of Biotechnology.
Human Rights Statement and Informed Consent
This article does not contain any studies with human and animal subjects performed by the any of the authors. Informed consent was obtained from all patients in the study within the framework of IVF programs.
Funding Source
This research did not receive any specific grant from funding agencies in the public, commercial, or not-for-profit sectors.
Data Availability Statement
All data generated and analyzed in this study, including the full processed dataset, raw anonymized embryological and clinical variables, statistical outputs, and the complete machine learning pipeline, are openly available in the public GitHub repository: https://github.com/embryossa/Z-score_new_life. All resources are released under an open license and may be freely reused for replication, validation, or further methodological development.
CRediT author statement
Noira Nigmatova: Conceptualization, Data curation, Project administration, Resources, Supervision, Writing – Extensive Review and Editing.
Sergei Sergeev: Methodology, Formal analysis, Writing - Original draft, Writing – Extensive Review and Editing, Visualization.
Yelarman Buyanzhargal: Supervision, Investigation.
Balzhan Kaldarbekova: Investigation.
Gulnur Arstanbayeva: Conceptualization.
Madina Azimkhan: Conceptualization.
Natalya Khonik: Writing - Review and Editing.
Aizhan Makisheva: Writing - Review and Editing.
Vladimir Shchigolev: Writing - Review and Editing.