Introduction
Infertility affects millions of people of reproductive age worldwide – and impacts their families and communities. Estimates suggest up to 186 million individuals live with infertility globally.1 In-vitro fertilization (IVF) is the most common technique in assisted reproductive technology. IVF is also effective for infertility in women with polycystic ovarian syndrome (PCOS). Superovulation is a drug-induced method to enable multiple oocytes per menstrual cycle in IVF. The success of IVF depends upon successful superovulation, defined by the number and quality of eggs retrieved in a cycle. Superovulation is also vital for IUI (Intra-uterine insemination).
The drugs used in this treatment are expensive. A recent article in Forbes suggests that the current cost of IVF in the United States ranges from $15,000 to $30,000, and 35% of the cost is related to drugs.2 Currently, this step is executed using almost daily monitoring of the follicular development using ultrasound and blood tests. The daily dosage of hormones is then chosen for each patient based on the physician’s experience. Although there are general guidelines for the dosage, the dose is not optimized for each patient, and overstimulation complications can occur.3 A recent study of 7399 IVF cycles from Harvard University concluded that Follicle Stimulating hormone (FSH) and Human Menopausal Gonadotropin (HMG) ovarian stimulation drugs are typically applied at saturating or slightly deleterious doses. The dosage of these hormones can be reduced.4 A recent review5 on IVF modeling emphasizes that the future of IVF treatment will use optimal treatment based on models. The cost of testing – frequent transvaginal ultrasounds (US), blood tests, and drugs- makes the superovulation stage very expensive. To overcome the shortcomings of this system, we have developed a user-friendly decision support tool (Opt-IVF) that can provide a personalized model of this stage for each patient’s superovulation cycle. Customized optimal drug treatment profiles can then be developed for each patient using optimal control methods provided by the software. The model is based on the size distribution of follicles on day 1 and day 5 of a superovulation cycle. This, together with the FSH doses used on days 1 to 4, provides a basis for predicting the FSH doses to be given on day 5 and subsequent days to achieve better outcomes – maximizing the number of mature follicles. The Opt-IVF algorithm can also forecast the best time to begin antagonists and the optimal trigger day to maximize the recovery of mature oocytes. A recent non-randomized clinical trial with retrospective controls6 has demonstrated the tool’s success in clinical practice. Test subjects had higher numbers of mature Mii oocytes, required 30% lower cumulative FSH doses, and had higher numbers of high-quality embryos. We report here on a randomized clinical trial using Opt-IVF to guide superovulation.
Materials and Methods
All clinical work was conducted at the Akansha Hospital and Research Institute in Gujarat, India. The institutional review board at Sat Kaival Hospital Pvt. Ltd. Ethics Committee, Gujarat, India, approved the protocol and consent forms. All participants provided written informed consent. Patient safety was reviewed throughout the study by the clinical investigators (Nayana Patel, Niket Patel, M. Patel, H. Bhadarka, P. Ghoghari, and K. Vyas), who were responsible for clinical work and data collection. U. Diwekar and S. Joag are responsible for the study design, data analysis, and interpretation and writing of this manuscript. All authors contributed to the review and editing of the manuscript and approved the final version for submission. All authors vouch for the data’s accuracy and completeness and the protocol’s fidelity to the trial.
The decision tool Opt-IVF
Opt-IVF is a unique tool that provides optimal and personalized dosage profiles for a complete superovulation cycle. The difference between this approach and the machine learning approaches7–11 presented in the literature is provided in Table 1.
Initial Dose
Opt-IVF provides an initial dose based on either the nomogram proposed by La Marca and Sunkara,12 which predicts the initial dose based on age, day 3 serum FSH, and AMH, or based on heuristics using age, AMH, and AFC values.
Dosage Profile for the Rest of the Cycle
IVF’s success depends on successful superovulation, defined by the number and uniformly high quality of eggs retrieved in a cycle. This requires frequent monitoring of follicular development using ultrasound and blood tests to decide day-to-day dosage. Although there are general guidelines for stimulatory hormone dosage, individualization of dosage is primarily driven by the physician’s experience and clinical judgment. To overcome the shortcoming of this system, we developed a mathematical procedure that can provide a personalized model of this stage for each patient by considering the change in the distribution of follicles due to the chemical interactions of the drugs used. The aim is to obtain the maximum number of mature follicles (18-22 mm) at the end of the cycle. Optimal control theory decides personalized, optimized dosages for each patient.13,14
Opt-IVF creates a personalized model using day 1 and day 5 follicular size distribution data (as shown in Table 2, obtained by ultrasound), and the initial dosage is given to the patient. Thus, the model is customized for that patient, that cycle, and the FSH dose used on days 1 to 4. We used data from 150 patients (70 agonist protocol and 80 antagonist protocol patients) from three IVF centers in India and one IVF center in the United States to validate the model. The individualized model for a cycle is then used to optimize the dosage for the remaining days using optimal control theory. This approach reduced dosage and testing, with similar or better outcomes regarding the number of mature follicles. The model, theory and initial validation details are published elsewhere.13,14
The Clinical Trial
The trial was registered on ClinicalTrials.gov (ID NCT05564702). We use Simple Randomization of all patients registered for the trial. A ‘lottery method’ was used to assign patients to test and control. Based on a previous non-randomized clinical trial,6 a sample size of 45 patients in each arm was considered sufficient. We conducted power analyses for two important outcomes, the total dosage and the number of high-quality embryos. To get a power of 0.95 with a significance level of 0.05 for an average total dosage to be 20 % lower in the test than in controls, we needed 18 subjects in each arm. At the same power level, for high-quality embryos to be 60% higher in the test than the control group, we required 38 subjects in each arm. Therefore, a sample of 45 in each arm was more than sufficient for our analysis.
An Antagonist protocol was used for all patients, using Recombinant FSH (Gonal – F, Merck), R-Hu-LH (Merck), and Cetrorelix 0.25 mg (Bharat Serum and Vaccines Limited). Participants were categorized before enrollment as expected poor responders (PR), expected normal responders (NR), and PCOS based on Age, AMH, and clinical presentation. All participants had transvaginal ultrasound exams (US) to quantify the number and size of follicles on day 1 and day 5 of the cycle. This information was entered into the Opt-IVF decision support tool for test group patients, which suggested FSH doses for day 5 and all subsequent days of the cycle. All recommendations of the decision support tool were made available to the clinical investigators before day 1 and on day 5.
Control participants also had US on days 7 and 9. The participating clinical investigators retained the ability to override Opt-IVF dose recommendations based on their clinical judgment but did not do so in any patient. For control group participants, the hormone doses each day were based on the participating clinical investigators’ choice. Although Opt-IVF recommended trigger days, this feature was not tested in this trial. The trigger days in all test and control participants were entirely based on the participating clinical investigators’ choice. There were no differences in the dosing of trigger hormones. Mii oocytes were considered mature if at least one polar body was present.
The primary outcomes measured were the cumulative FSH dosage, the number of mature and Mii oocytes retrieved, the total number of embryos, and the number of high-quality (Grade A) embryos obtained after in-vitro fertilization in each cycle. High-Quality Embryos were assessed with the Recent Gardner Grading. Morphologically Normal is known to be good quality (Grade A). Clinical pregnancy rates for patients were measured. 80% of embryos transferred were frozen embryos. Statistical analyses were performed using Microsoft Excel. For statistical analysis of cumulative doses, total and Mii oocytes, total embryos, and grade A embryos, we used two-tailed t-tests with unequal variance (heteroscedastic). For pregnancy data, we used the chi-square statistic. The statistical significance level was kept at p<0.05 for all analyses.
Results
Test and control participant groups were similar in age, and the proportions of expected normal responders, poor responders, and participants with PCOS are given in Table 3
Table 4 presents the results for cumulative total average FSH dosage. The cumulative FSH doses administered to test participants were lower than the doses administered to control participants. The differences in dosage were statistically significant overall and also for each subgroup. On average, the cumulative FSH dose in test participants was 26% lower than in controls. Although clinical investigators had the discretion to override Opt-IVF recommended doses, they did not do so on any day for any participant.
The number of oocytes retrieved and Mii oocytes were statistically similar among test participants and control in total and each subgroup (Table 5). The total embryos were significantly higher in test participants than in controls (Table 6). On subgroup analysis, the total numbers of embryos were significantly higher for test group poor responders, though no statistical differences were observed among normal responders and PCOS patients. The number of high-quality embryos (Table 7) was significantly higher in test participants than in controls. A statistically significant difference was found in all three subgroups.
NR and PR - Normal responders and poor responders, respectively.
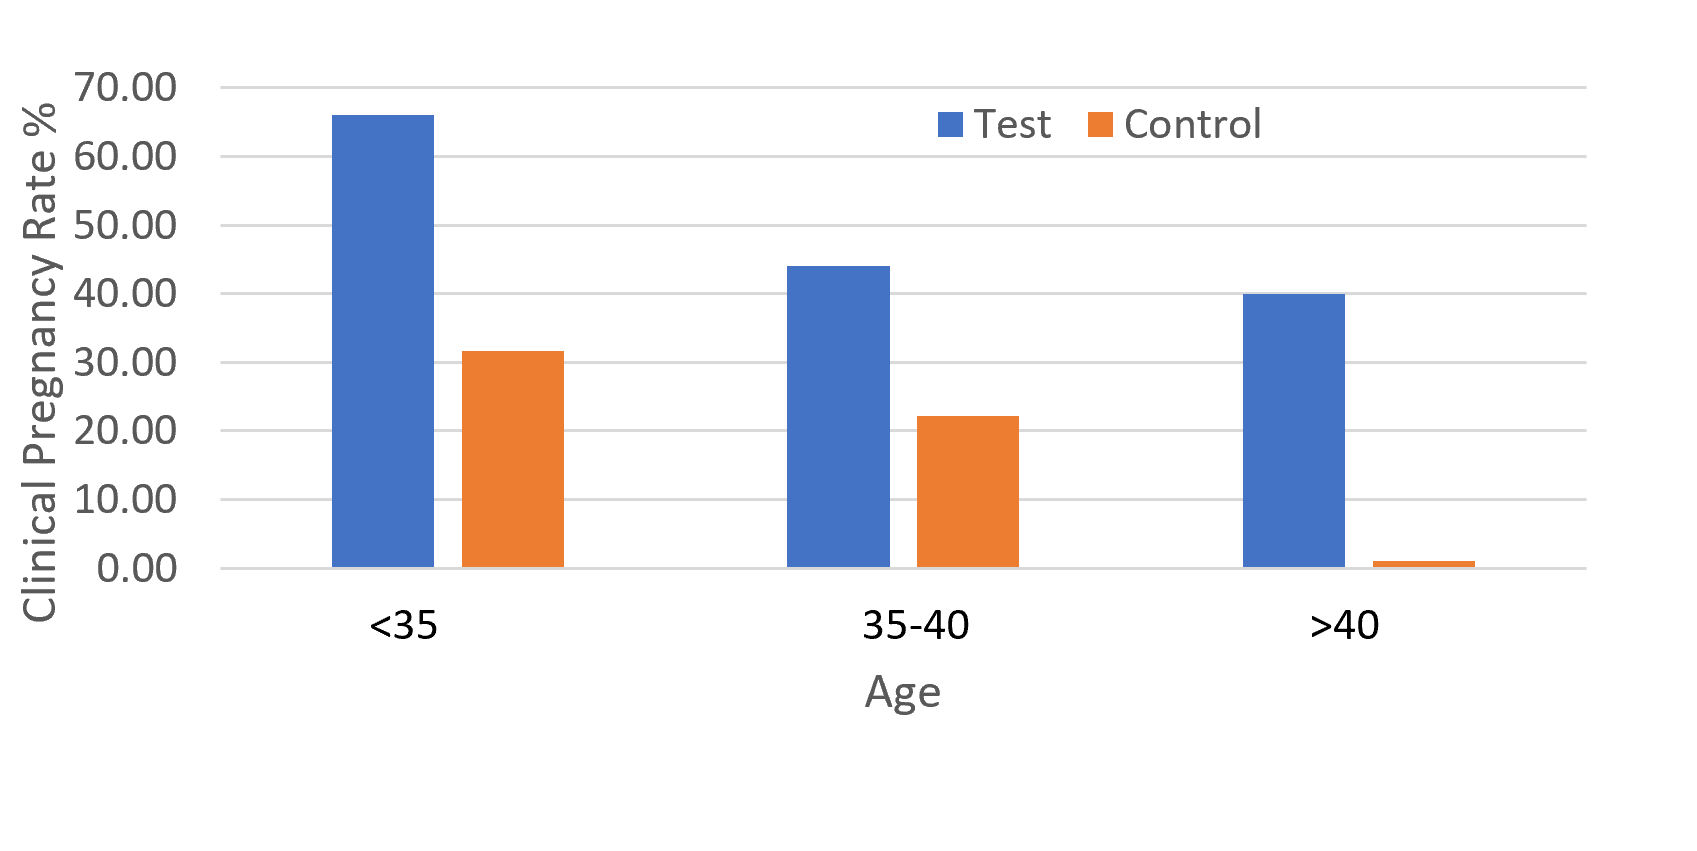
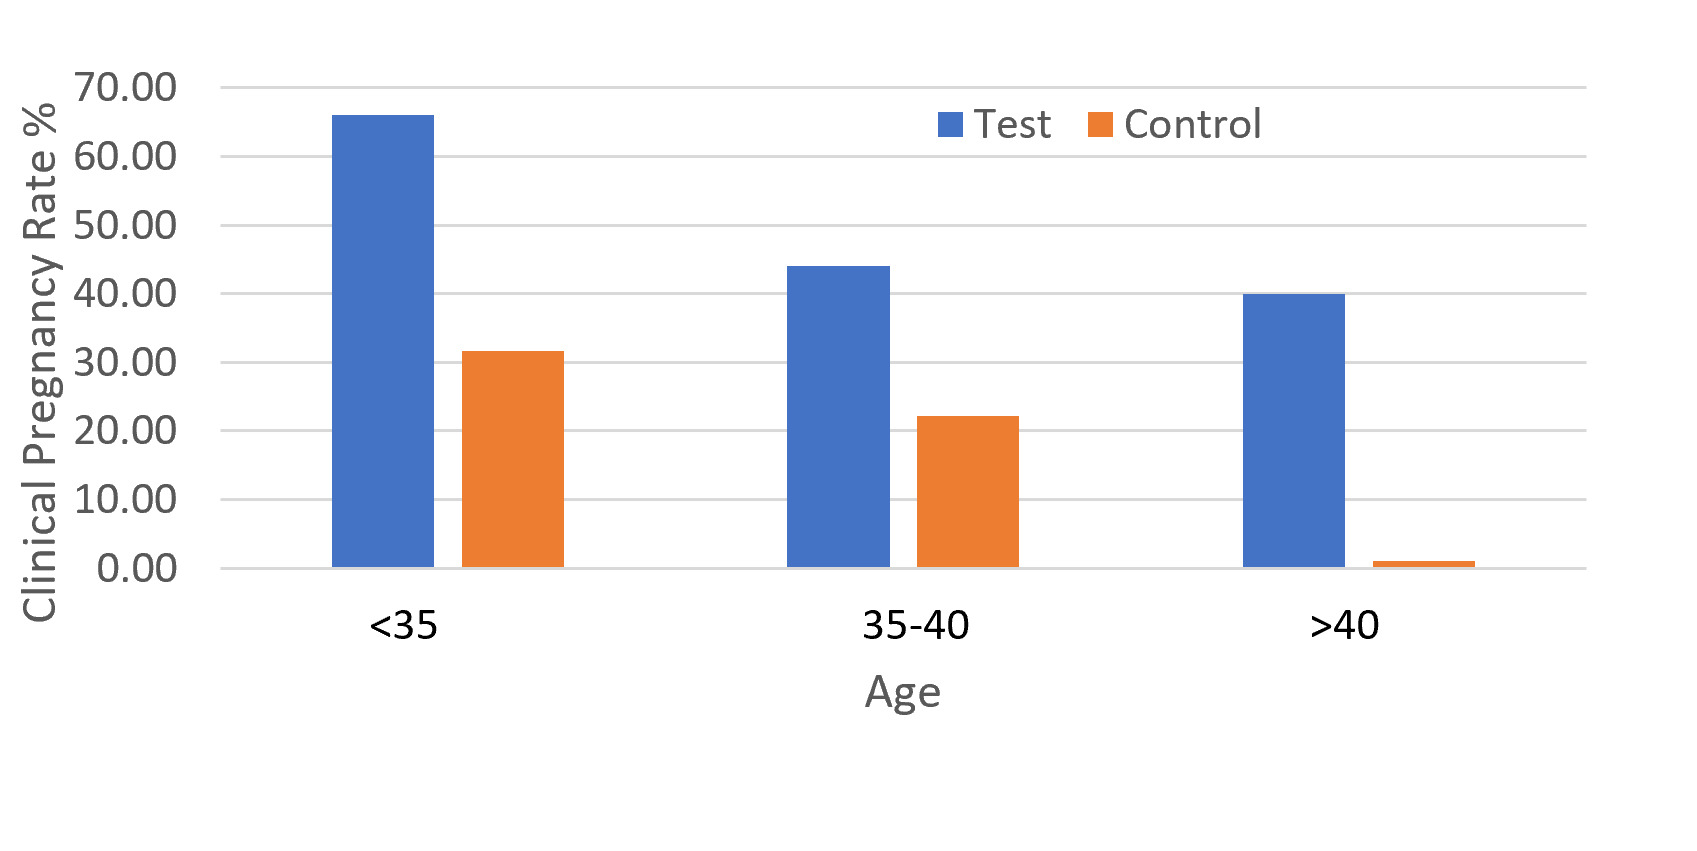
We could not get clinical pregnancy results for all participants because the travel schedule of some patients did not allow the transfers to be completed. Currently, we have data for 44 of 48 test group patients and 31 of 45 control group patients. The clinical pregnancy rates were significantly higher (chi-square statistic 3.92, p = 0.048) in test patients as compared to control patients, as shown in Table 8. For poor responders and PCOS patients, pregnancy rates in the test group are higher than clinical pregnancy rates reported in the literature.15–18
The clinical pregnancy rate was higher in test patients than in controls at all ages (Figure 1).
Discussion
This paper described a clinical decision support tool for predicting the complete dosage profile from day 1 to the end of the cycle using modeling and optimization. The tool is based on a physics-based model13,14 that can be personalized for each patient based on the cycle’s follicle size distribution data for day 1 and day 5. Optimal control theory is then used to predict the optimal dosage profile for the complete cycle to minimize the variance in follicle sizes at the end of the cycle. This paper presents the first randomized trial to study the effectiveness of the decision support tool, Opt-IVF. This trial aimed to investigate the use of Opt-IVF, a clinical decision support tool, in guiding superovulation to reduce the need for US testing and lowering hormone dosage while maintaining comparable outcomes regarding oocyte retrieval, embryo quality, and pregnancy rates. The model was previously validated and showed that using the tool could reduce hormonal dosage and testing and improve outcomes. Our study with 93 patients was sufficient to provide statistically significant results for hormone dosage and embryos obtained. The trial utilized a personalized approach to hormone dosing based on optimal control theory, a new approach in the field of in-vitro fertility.
Our results showed that using a clinical decision support tool eliminated the need for transvaginal US exams after day 5 of a superovulation cycle. Test participants had US only on days 1 and 5, while controls required the US on days 1, 5, 7, and 9. This represents a 50% reduction in US testing during a superovulation cycle. Using the tool significantly reduced stimulatory hormone doses in all three subgroups - normal responders, poor responders, and PCOS participants, which is likely to lower the overall costs of treatment, especially in resource-poor settings. None of the participants in the trial developed OHSS or other significant side effects. These results were similar to those of a previous clinical trial with retrospective controls.6 We had calculated that a sample size of 189 in each arm would be required for a power of 0.8 with a significance level of 0.05 for a 15% higher oocyte yield in the test than in controls. The numbers of oocytes retrieved and Mii oocytes did not differ significantly between the test and control groups, and the study was underpowered to detect differences in this measure.
Although the trial’s aims did not include pregnancy rates, an unexpected result was that the test group had significantly higher numbers of high-quality embryos and clinical pregnancy rates than the control group. The higher pregnancy rates and high-quality embryo numbers were particularly noticeable in poor responders and PCOS patients. The clinical pregnancy rate in older patients compares favorably with published reports.19 Our results suggest that using this clinical decision support tool will be particularly valuable in more challenging cases: PCOS, poor responders, and relatively older women.
Among the limitations of this study are that it is a single-center trial and that the patients were all from a single ethnic background (Indian), which might limit the generalizability of our results. However, the model underlying the clinical decision support tool was validated in patients from India and the US, suggesting that the results likely apply to patients of other ethnicities. As the model is individualized for each patient, other confounding factors are unlikely to affect the results.
Conclusion
The clinical trial demonstrated that utilizing the clinical decision support tool, Opt-IVF, to guide hormone dosing during superovulation resulted in lower hormone doses and eliminated the need for ultrasound testing after day 5 of the cycle. This approach led to increased total and high-quality embryos and higher pregnancy rates in the test group compared to the prospective control.
Authors’ Contribution – CrediT
Conceptualization: Urmila Diwekar; Data curation: Urmila Diwekar, Sanjay Joag; Formal Analysis: Urmila Diwekar and Sanjay Joag; Investigation: Urmila Diwekar, Nayana Patel, Niket Patel, Harsha Bhandarka, Molina Patel, Paresh Ghoghari, Kairavi Vyas, Sanjay Joag; Methodology: Urmila Diwekar, Nayana Patel, Sanjay Joag; Project administration: Urmila Diwekar; Software: Urmila Diwekar; Supervision: Urmila Diwekar and Nayana Patel; Validation: Dr. Urmila Diwekar, Sanjay Joag; Writing – original draft: Urmila Diwekar, Sanjay Patel; Writing – review & editing: Urmila Diwekar, Nayana Patel, Sanjay Joag.
Funding Statement
No external funding
Disclosure Statement
Urmila Diwekar and Sanjay Joag have an ownership interest in Stochastic Research Technologies LLC, which owns and markets Opt-IVF. Nayana Patel, Niket Patel, Harsha Bhandarka, Molina Patel, Paresh Ghoghari, and Kairavi Vyas have no disclosures.
Funding Statement
No external funding
Attestation Statement
-
The subjects in this trial have not been involved in other randomized trials.
-
Data regarding any of the subjects in the study has not been previously published unless specified.
-
Data will be made available to the journal editors for review or query upon request.
Data Sharing Statement
Data on individual patients will be shared in spreadsheet format to the corresponding author upon request.
Trial registration
ClinicalTrials.gov (ID NCT05564702).
Date of Registration: Oct. 3, 2022. Date of enrolment of the first subject: Oct. 10, 2022.